Top 10 GEO Services for Eastern Europe
Updated: 10.06.2026
Some of the most popular GEO (Generative Engine Optimization) platforms are mentioned below.
Users that searched for Top 10 GEO Services for Eastern Europe then also viewed the following software: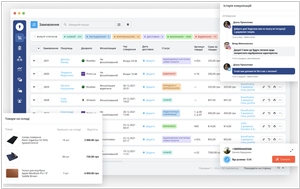
See also: Top 10: SEO Services for Eastern Europe
Users that searched for Top 10 GEO Services for Eastern Europe then also viewed the following software:
See also: Top 10: SEO Services for Eastern Europe
2026. HubSpot now offers AEO module
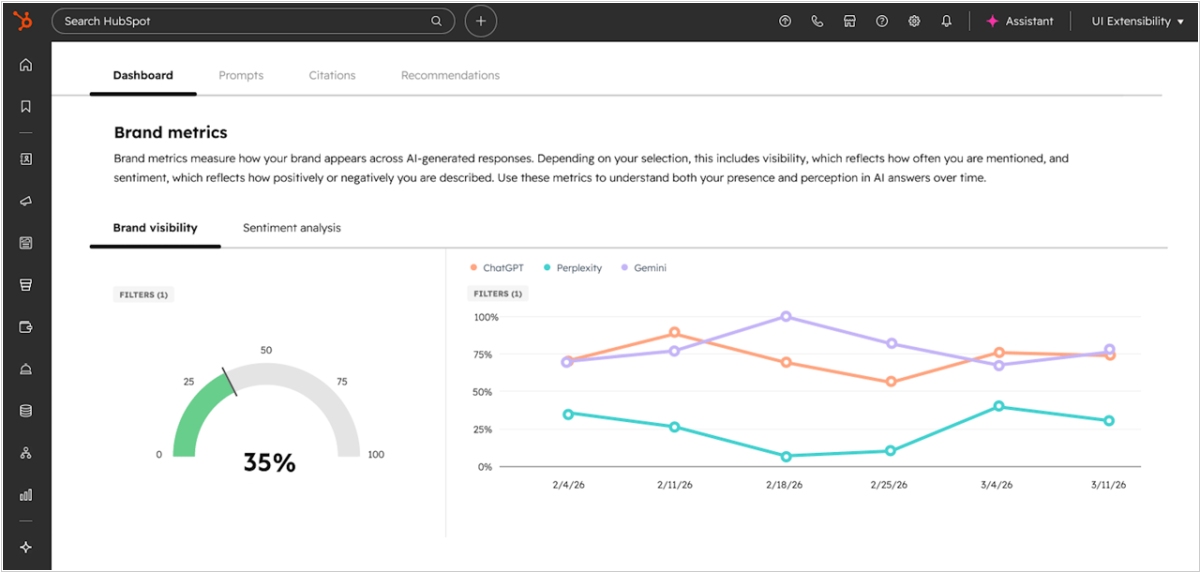
Marketing automation service HubSpot, for some reason, didn't go along with the crowd that uses word GEO, but instead using own term AEO (Answer Engine Optimization) to describe its new AI chat monitoring tool. However, the idea remains the same: HubSpot AEO provides information about how your company performs in tools like ChatGPT, Perplexity, and Gemini. You enter a website address, and it returns a list of queries for which information from your site appears in the chat answers, as well as a list of queries for which your competitors appear while you don't. Then, using data from Marketing Hub, the service creates a content creation plan to fill these niches and improve your rankings.
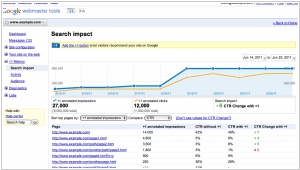
2026. Microsoft Clarity offers LLM-bot analytics
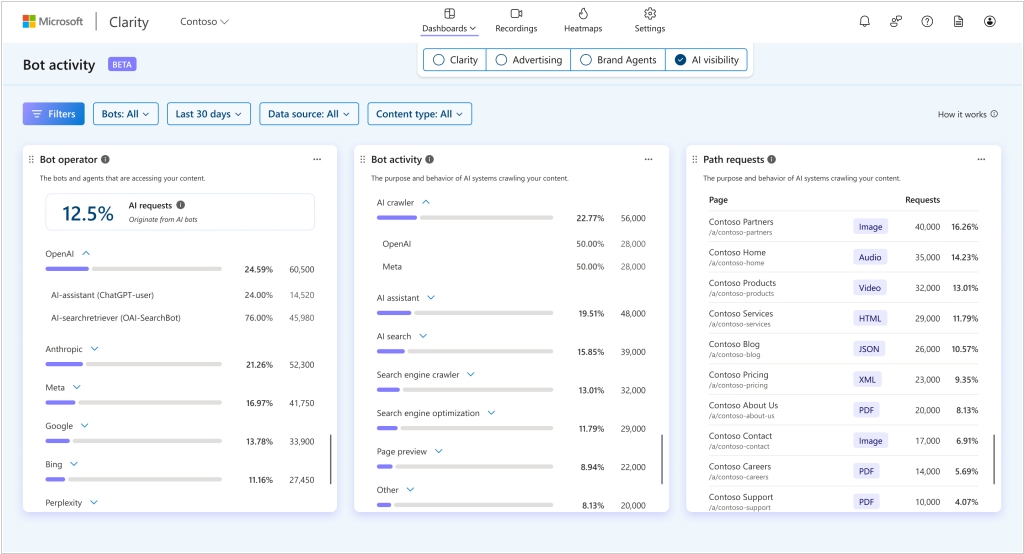
Web analytics system Microsoft Clarity has added a new section AI Bot Activity. Site crawling by bots is often a signal that content may later be used by AI models. The new section shows how verified LLM bots interact with your content. You can see which AI platforms are accessing your site, how often and at what scale they crawl, and which pages, paths, and resources attract the most automated attention. This data helps transform bot traffic from background noise into a measurable audience, and helps you understand what content is of interest to LLM models and how to develop your site's content.
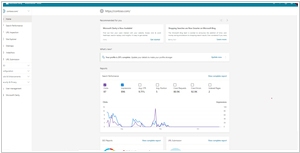
2026. Matomo adds report on AI chatbot activity
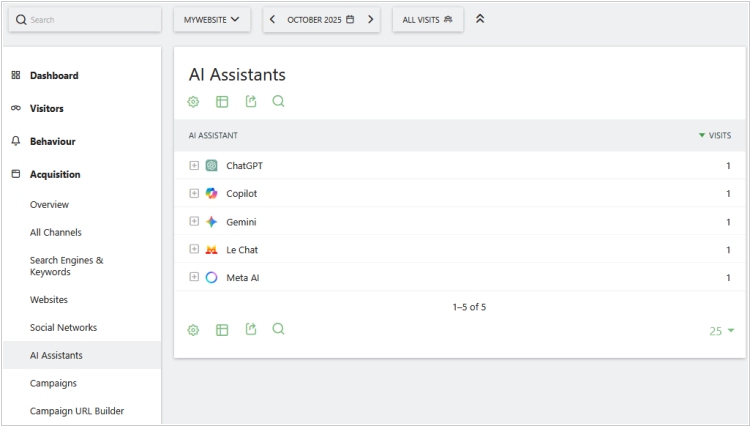
Matomo, the world's most popular open-source website statistics system, has introduced new capabilities for tracking AI assistant crawlers. The new report helps organizations understand how AI chatbots interact with their websites. When combined with the existing AI agent tracking module, it provides a clearer picture of how AI tools access and analyze website content. The new report separates automated AI activity from real users to analyze how AI agents consume and display your content in response to queries. It includes two predefined segments: AI agent and human, which allow you to compare visit summary metrics. To measure AI bot activity, Matomo uses integrations with Amazon Cloudfront, Cloudflare, or WordPress, which identify requests from known chatbots (which is why this feature is only available in the paid cloud version of Matomo).
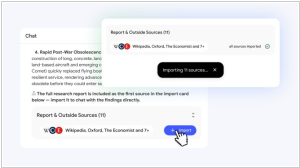
2025. Ahrefs Adds Custom Queries to GEO Monitoring
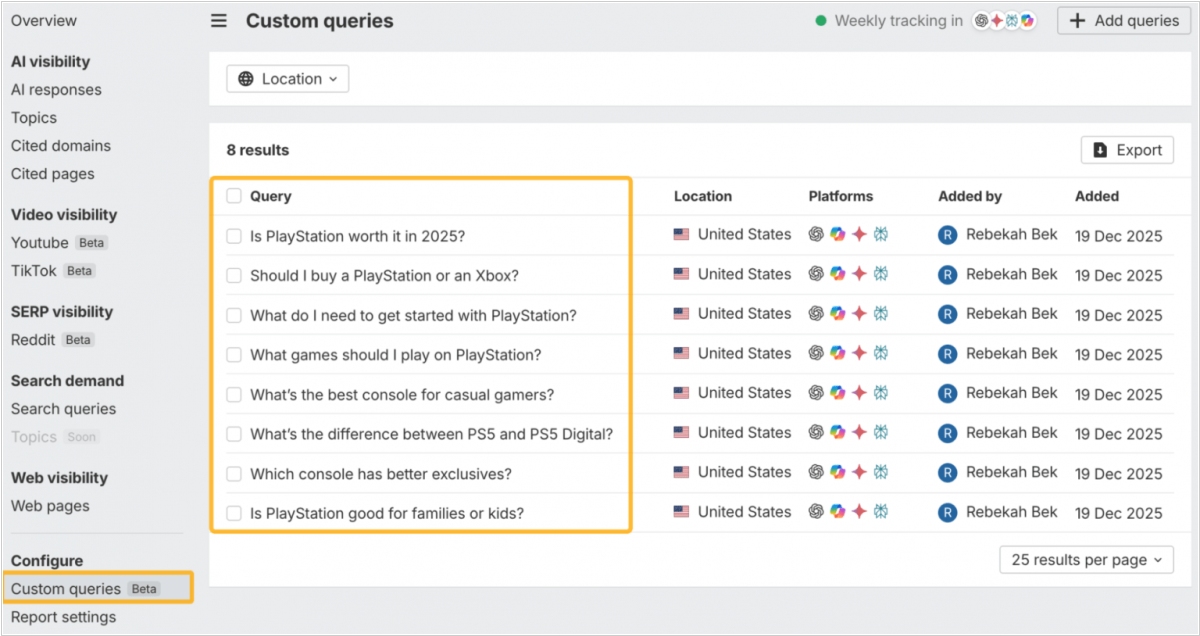
Now in Ahrefs, you can track brand mentions in AI chats using a list of your own queries (previously, only general market queries were available). Custom queries are currently supported for ChatGPT, Gemini, Perplexity, and Copilot. You can set up the tracking frequency: daily, weekly, or monthly, with different frequencies for each chatbot. Custom queries use validations based on query, AI chat and location. You can view both data sets (custom and market) in a single report or switch between them using the new "Data Set" filter, depending on whether you need visibility at the market or buyer level. Validations can be included in a paid package or paid separately as you go.
2025. Seowork gets search engine AI-block analytics
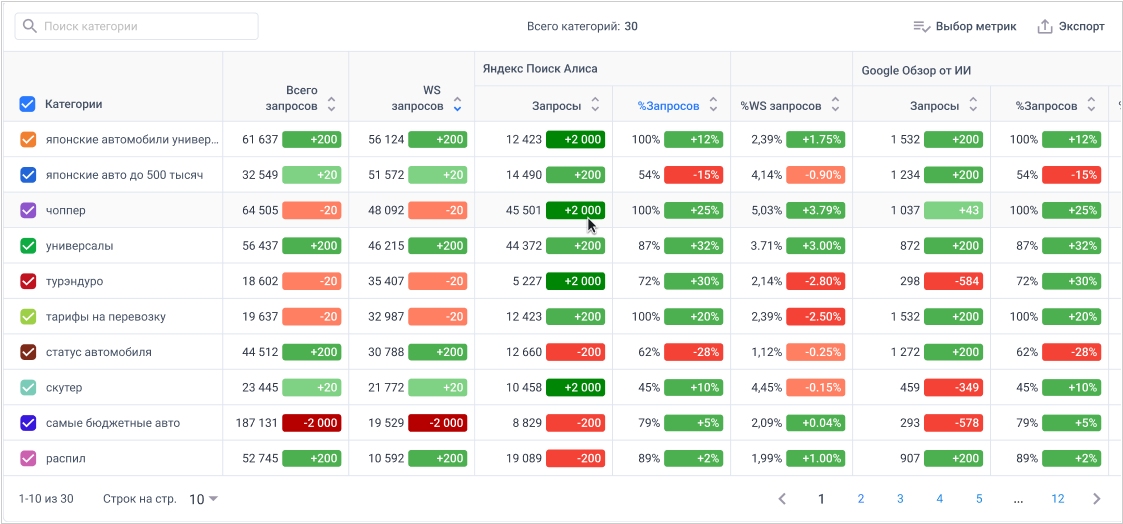
AI blocks in Yandex and Google significantly impact SEO. Seowork has added a "AI Responses" module, which shows the extent to which your keywords are covered by these boxes. This module requires no additional connections other than the keywords uploaded to the project. The system automatically parses search results and determines the percentage of your queries that contain AI answers. This allows you to assess the impact of AI on your traffic, especially in informational categories. Aggregated data in the table allows you to evaluate metrics and their dynamics across project categories. When selecting two dates in the calendar, the table displays data for the later collection date and the difference from the previous collection date selected in the calendar.